1
2
3
4
5
6
7
8
9
10
11
12
13
14
15
16
17
18
19
20
21
22
23
24
25
26
27
28
29
30
31
32
33
34
35
36
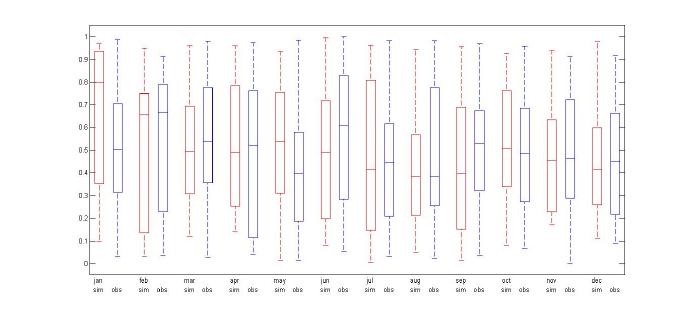
| 示例:
data = rand(20,24)
month = repmat({'jan' 'feb' 'mar' 'apr' 'may' 'jun' 'jul' 'aug' 'sep' 'oct' 'nov' 'dec'},1,2);
simobs = [repmat({'sim'},1,12),repmat({'obs'},1,12)];
boxplot(data,{month,simobs},'colors',repmat('rb',1,12),'factorgap',[5 2],'labelverbosity','minor');
另一种方法是利用不同坐标使用hold on在同一幅图上画箱线图
Temp_O = [Jan_O, Feb_O, Mar_O, Apr_O, May_O, Jun_O, Jul_O, Aug_O, Sep_O, Oct_O, Nov_O, Dec_O];
position_O = 1:1:12;
box_O = boxplot(Temp_O,'colors','b','positions',position_O,'width',0.18);
set(gca,'XTickLabel',{' '})
hold on
Temp_S = [Jan_S, Feb_S, Mar_S, Apr_S, May_S, Jun_S, Jul_S, Aug_S, Sep_S, Oct_S, Nov_S, Dec_S];
position_S = 1.3:1:12.3;
box_S = boxplot(Temp_S,'colors','r','positions',position_S,'width',0.18);
hold off
|